1 How to Calculate Percent Change in Excel2 Extra: How to Square Root in Excel3 Extra: How to Use Alternating Rows in Excel
The first thing you should know is that to calculate the percentage change between two numbers you must minus the new value from the old value, then divide it by the old value. Need an example? Let’s say we made $2 in ad revenue from an article in June. In July, there was a big increase traffic, leading to $7 in revenue. We would calculate percentage change like so: (7 - 2) ÷ (2) = 2.5 * 100 = 250%. What is percentage change? At this point, we should note that there is a difference between percentage change and percentage difference. Percentage change is used to calculate the difference between an old and new value. Percentage difference is used when both values are from similar time periods or origins. Therefore, you divide by the average of the two values rather than the difference between them. We’ll be showing you how to calculate percentage change in Excel today:
How to Calculate Percent Change in Excel
Extra: How to Square Root in Excel
Now that you know how to calculate percent change in Excel, you may be wondering how to perform other calculations. In our other tutorial, we’re showing you how to find the square root of a number in Excel using three separate formulas.
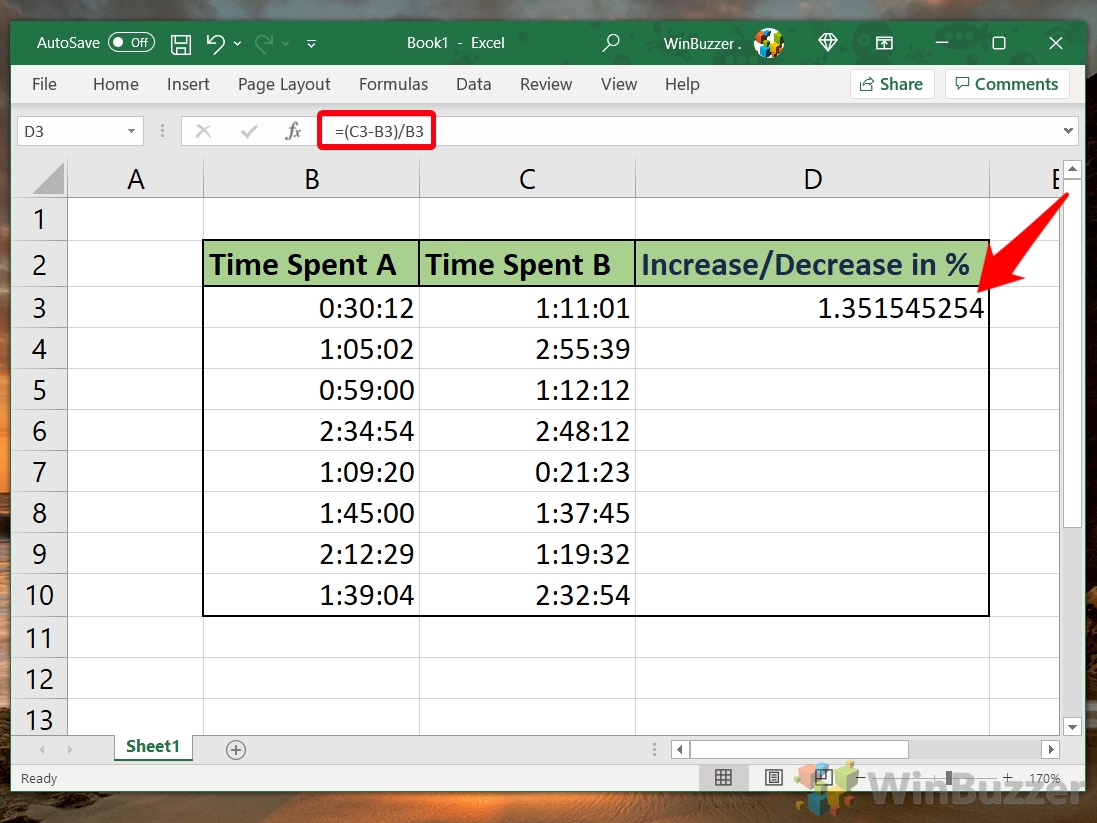
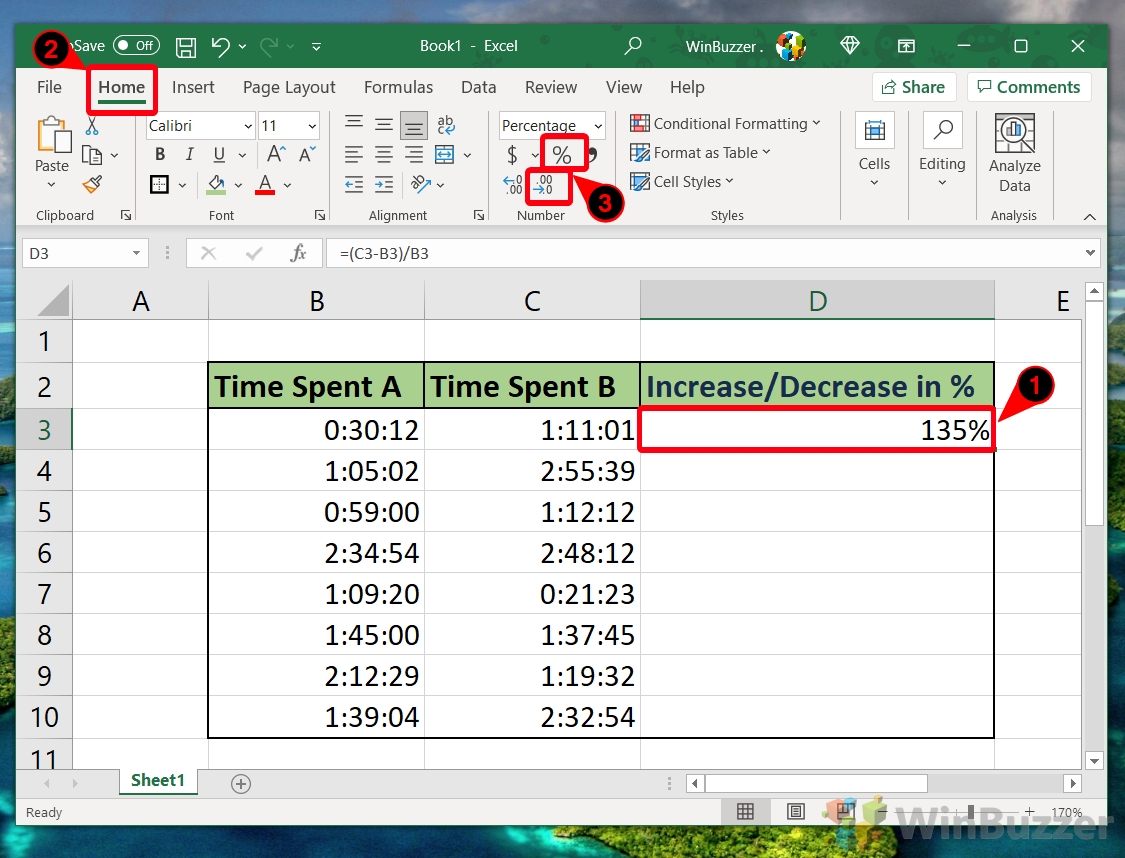
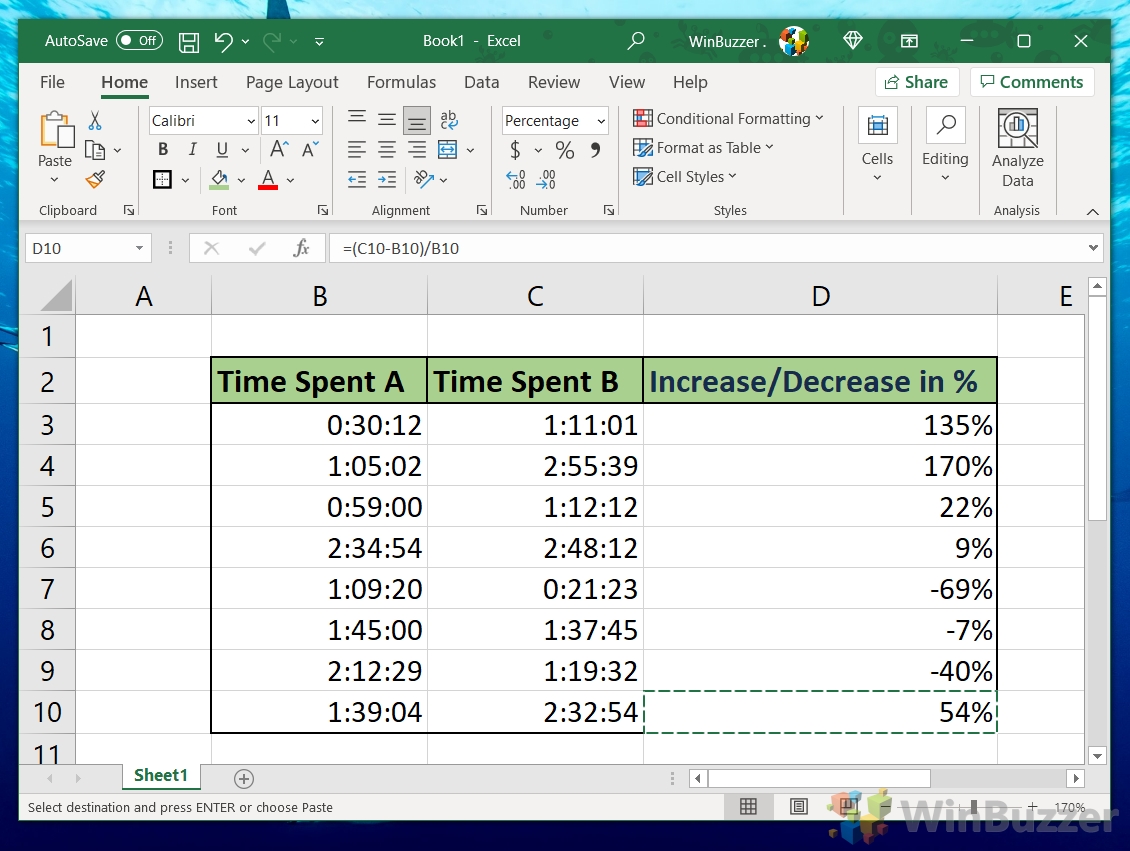
In our example, then, that would be =(C3-B3)/B3. The resulting value will be a small decimal that does not yet represent an accurate percentage change. For that, we need to change the formatting of the cell.
Extra: How to Use Alternating Rows in Excel
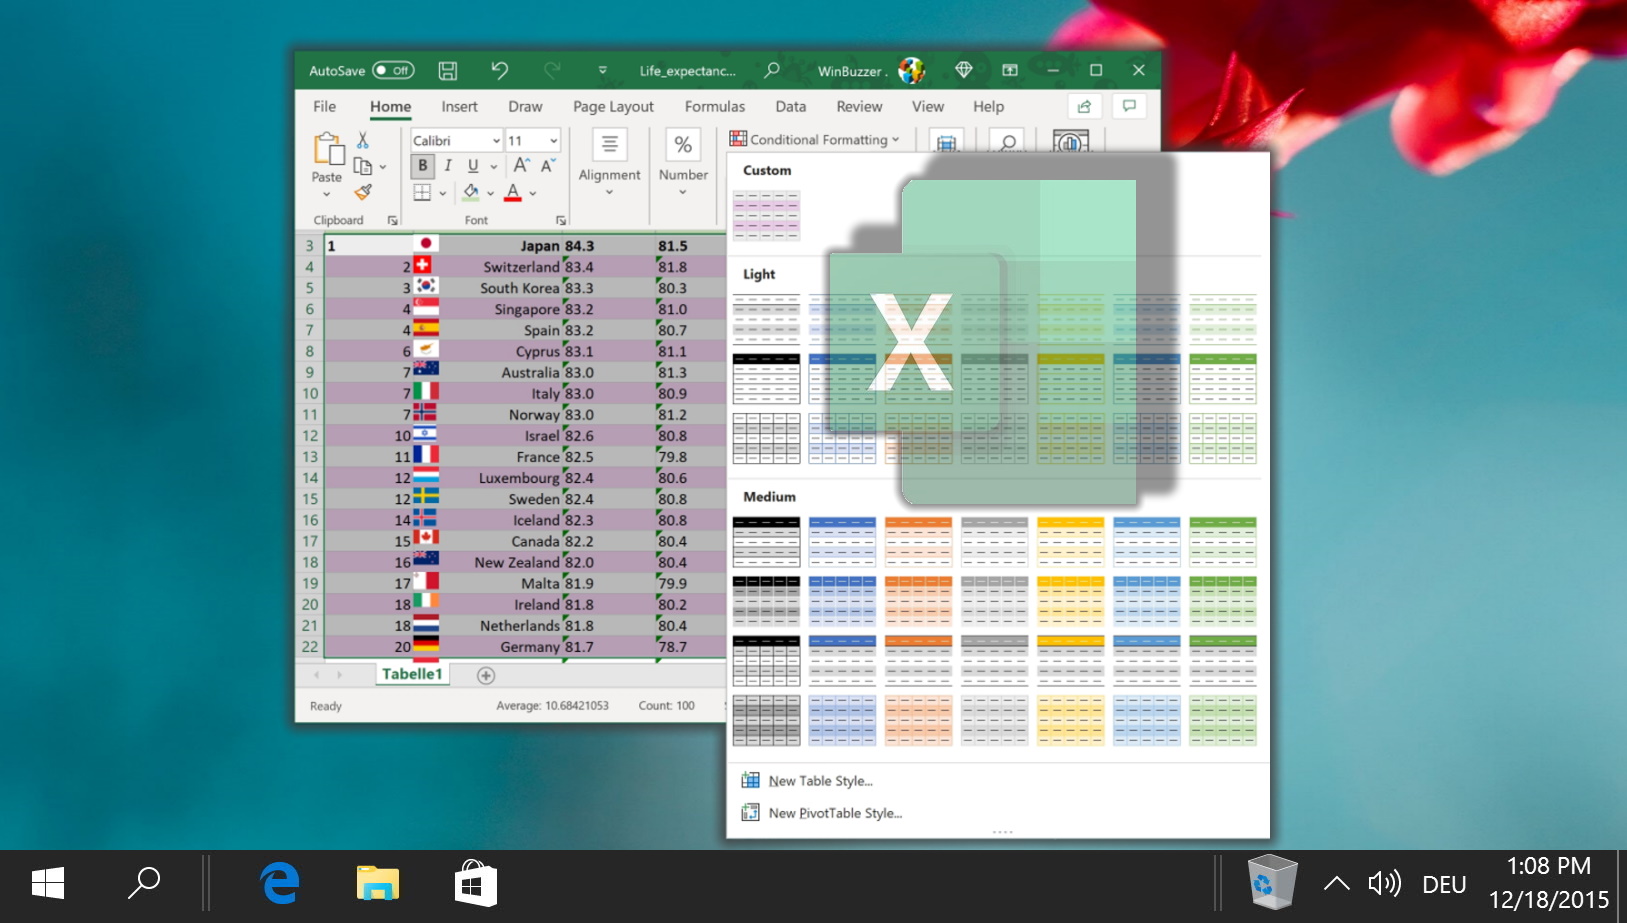
It’s an old trick at this point, but applying shading (zebra stripes) to alternative rows in Excel makes your sheet easier to read. The effect, also known as banded row, allows your eyes to keep their place more easily when you’re scanning a spreadsheet.


